
When the Climate Stripes Reach My Garden
By Tracey Chaykin, award-winning artist, CRBA member, and committed environmental advocate.
“Plants respond to the world as it is—not the world we remember, expect or would prefer it to be.”
Sometimes the most complicated stories can be told without a single word.
A line of blue. Another blue. Then pale blue. White. Peach. Orange. Red. And eventually, deep crimson.
Perhaps it is the artist in me, but I was immediately drawn to the visual simplicity of Show Your Stripes. Before I understood all the data behind the colors, I understood the story they were telling. Color—one of our most fundamental forms of visual communication—had transformed nearly two centuries of climate history into an image I could absorb in seconds.
That is the remarkable simplicity behind Show Your Stripes, the climate visualization created by climate scientist Professor Ed Hawkins at the University of Reading. Each vertical stripe represents one year of average temperature. Blues indicate years that were cooler than the 1961–2010 average; reds indicate years that were warmer.
There are no equations to decipher and no complicated graphs demanding interpretation. Just color.
And yet, when the stripes stretch from 1850 to 2025, they tell a story that is difficult to ignore.
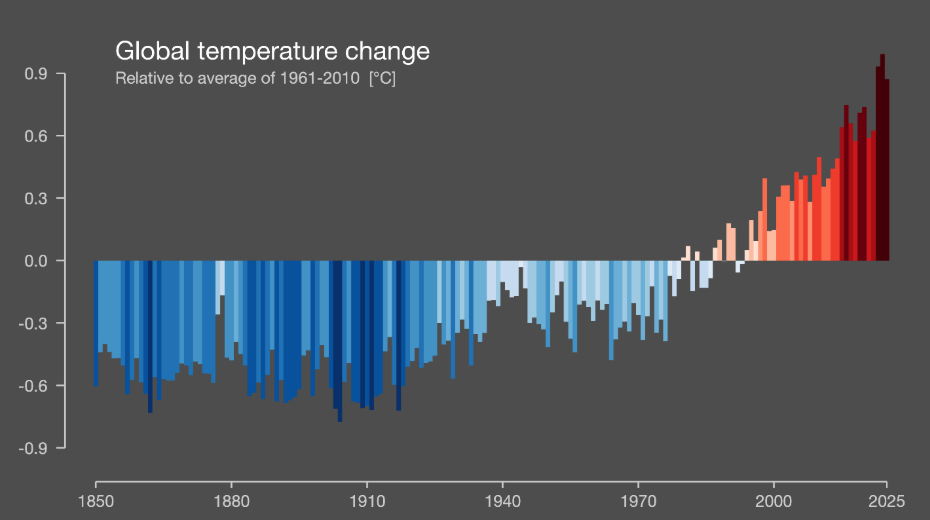
The early portion of the global image is dominated by blues. As the decades progress, those blues gradually fade. Then the reds appear. By the time we reach the most recent decades, they become increasingly concentrated and increasingly dark.
The Climate Stripes, first created by Hawkins in 2018, were designed precisely for this purpose: to transform temperature data into something immediately understandable. Today, the project includes graphics for more than 1,000 cities, countries and regions around the world, using updated temperature data from Berkeley Earth.
The newest stripe, representing 2025, adds an interesting chapter. It is not as hot as 2024, the warmest year ever measured globally, but it is hardly a return to the climate of the past. NOAA ranks 2025 as the third-warmest year in a global record extending back to 1850.
That distinction matters.
Climate change does not mean every year will be warmer than the one before it. Weather is still fluctuating. Some summers are hotter, some milder; some winters wetter, some drier. Climate becomes visible when we step back far enough to see the pattern.
And the stripes make that pattern remarkably difficult to miss.
Bringing the Stripes Home
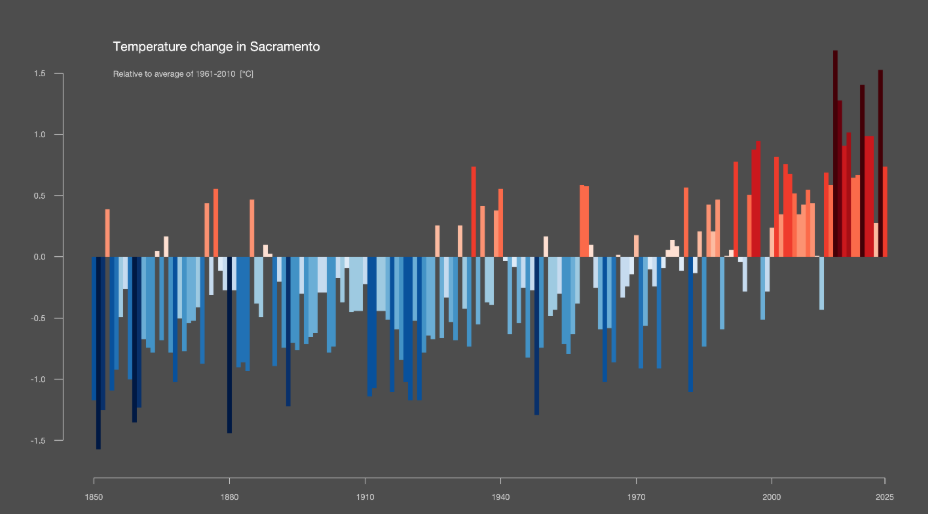
The story becomes even more compelling when we move from the global image to Northern California.
Compare the global warming stripes with those for Sacramento and the overall trajectory is familiar: blue dominates much of the earlier record, while warmer shades increasingly crowd the recent decades.
Sacramento's individual years are naturally more variable than the global average. A city responds to regional weather patterns, geography and local conditions, while the global graph averages temperatures across an entire planet.
But beneath that variability is the same larger movement toward warming.
And 2024 certainly made itself known.
California experienced its warmest July on record in 2024, according to NOAA. Northern California was hit particularly hard by prolonged extreme heat. Sacramento endured repeated triple-digit temperatures, and July 2024 became the hottest month ever recorded in downtown Sacramento.
The following summer offered something quite different. In July 2025, Sacramento's highest temperature was 102°F, compared with 110°F at the same reporting station the previous July.
And several counties farther west, in my own Napa Valley garden, I watched that difference unfold one plant at a time.
My Garden Has Its Own Climate Stripes
I have maintained an organic garden long enough to know that no two growing seasons are identical.
Gardens have personalities. One-year tomatoes take over everything. Another year zucchini seems determined to colonize the neighborhood. Sometimes a crop that performed beautifully the previous summer sits stubbornly in the soil as if it has simply decided to take the year off.
But during the past several years, I have begun noticing something more than normal gardening unpredictability.
I have begun seeing climate through my plants.
The summer of 2024 was extraordinarily hot here in Napa Valley. The heat wasn't merely something I felt when I stepped outside. I could see it in the garden.
Leaves burned. Vegetables suffered. My tomatoes experienced such intense sun and heat that some developed what looked like actual blisters on their skin. Plants that normally tolerated our warm summers struggled under conditions that seemed to push them past their comfort zones.
There is science behind what I was seeing.
University of California Integrated Pest Management describes sunscald as damage caused by excessive sun exposure and notes that prolonged high temperatures can cause plant heat stress, producing symptoms such as scorched foliage, wilting, leaf rolling and dropped blossoms.
I have begun seeing climate through my plants… There is science behind what I was seeing.
Then came 2025.
Compared with the punishing heat of the previous year, our growing season felt noticeably cooler—and my garden responded.
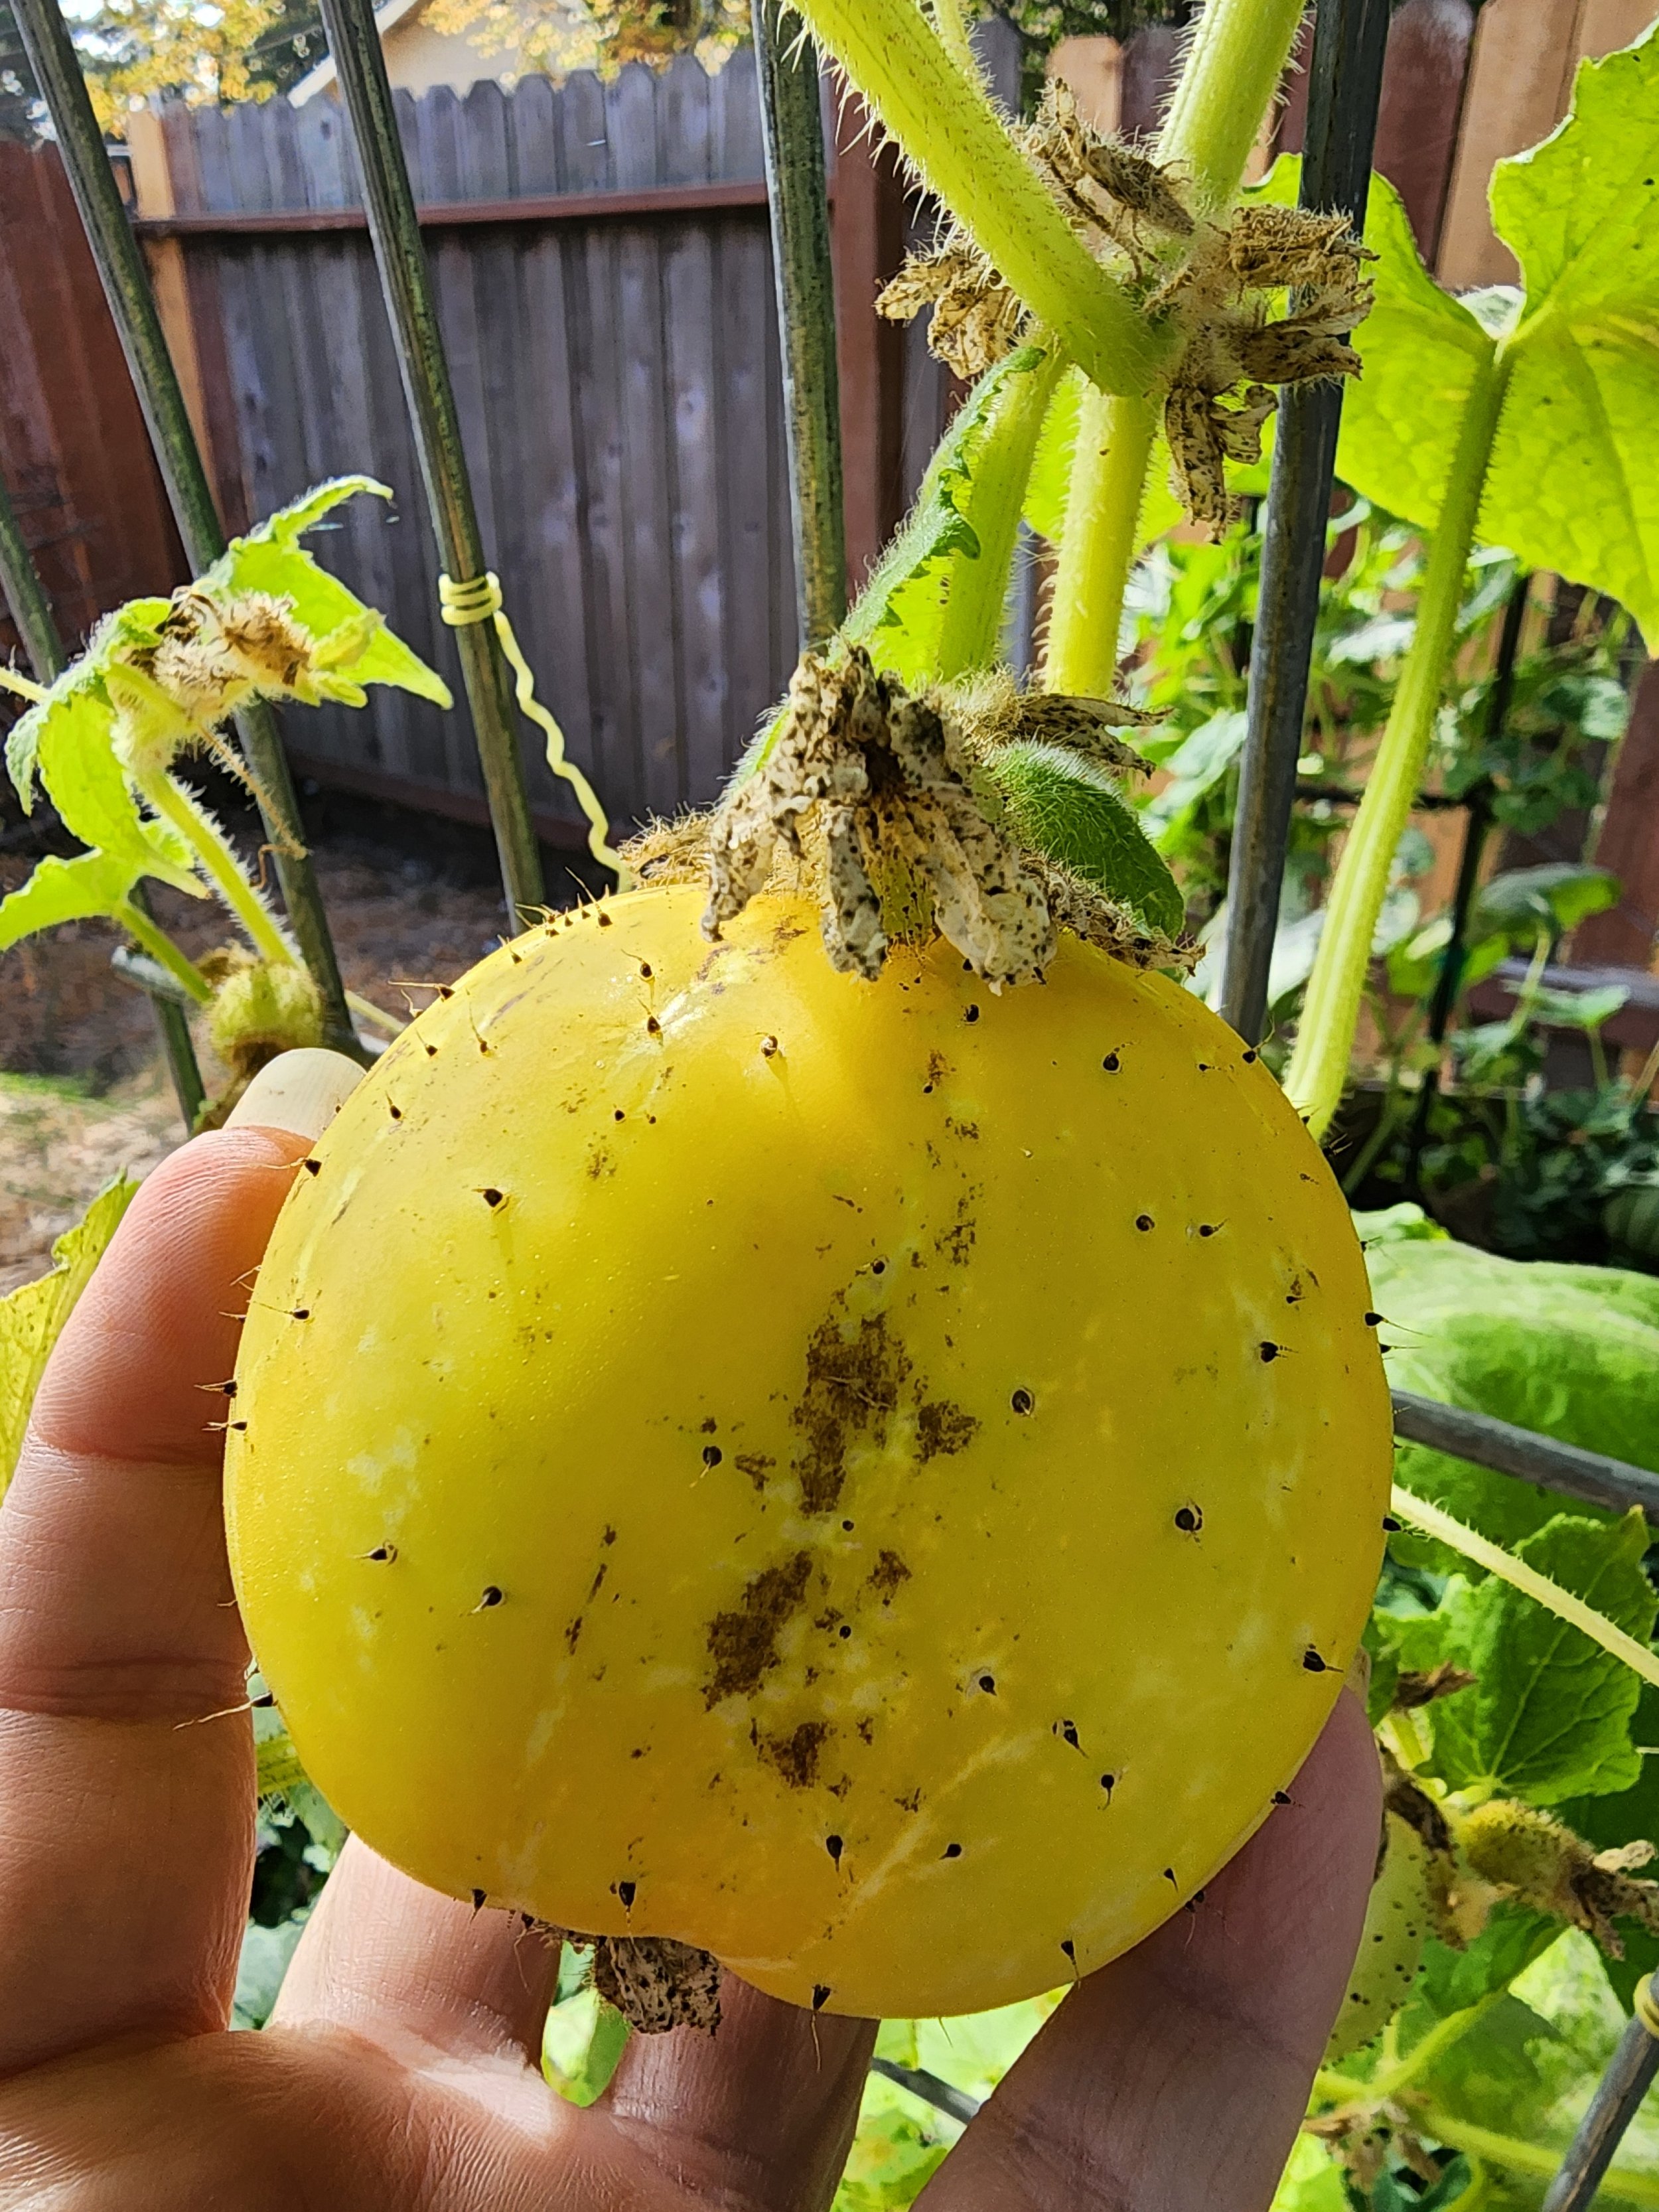
Some vegetables that had flourished in 2024 were suddenly less enthusiastic. Others that had struggled during the extreme heat came alive.
My melons and cucumbers, in particular, thrived.
The garden hadn't forgotten how to grow.
The conditions had changed.
That realization made me look at the Sacramento climate stripes differently. What initially seemed like an interesting scientific visualization suddenly felt surprisingly familiar.
I had been watching my own version of those stripes grow in the backyard.
The Mediterranean Climate We Know Is Changing
Napa Valley is famous for its Mediterranean climate: generally mild, wet winters and warm, dry summers. But anyone who lives here knows that describing Napa with a single climate label oversimplifies things tremendously.
We are a landscape of microclimates.
Fog, elevation, hillsides, valleys, proximity to San Pablo Bay and differences in topography can create remarkably different conditions within relatively short distances.
That diversity is part of what makes this region so extraordinary.
It does not, however, insulate us from a warming climate.
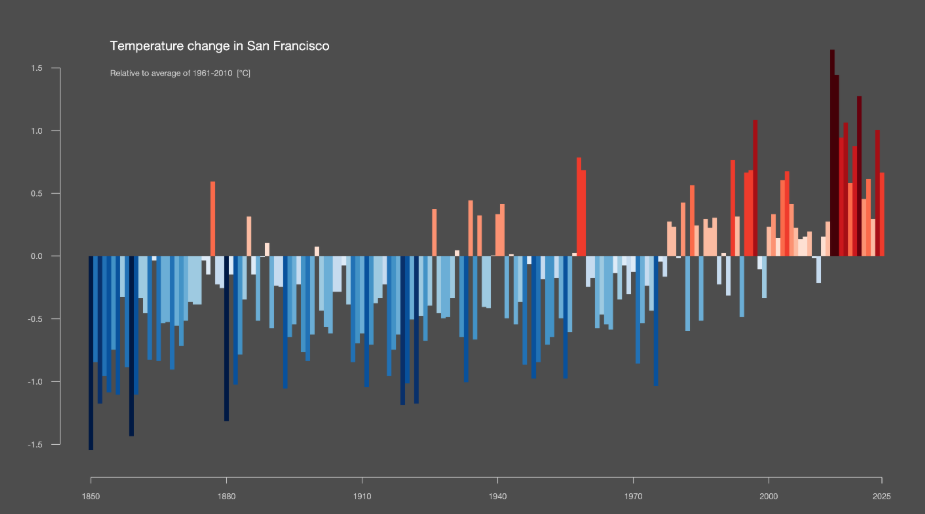
California's Fourth Climate Change Assessment describes the San Francisco Bay Area as a region confronting rising temperatures along with changing precipitation and fog patterns, wildfire risks, sea-level rise and impacts to agriculture.
Napa County's own Climate Vulnerability Assessmentgoes even closer to home. The county projects increasing temperatures and extreme heat, along with greater evaporation and evapotranspiration resulting in the movement of water from soils and plants into the atmosphere. These conditions can reduce soil moisture and increase irrigation demand. Agriculture, including Napa's vineyards, is specifically identified as vulnerable to these changes.
California's Cal-Adapt tools similarly project increasing numbers of extreme-heat days and warm nights across much of the state as the climate continues to change.
These are projections drawn from sophisticated climate models.
But sometimes their meaning becomes clearest when you're standing in a garden holding a damaged tomato.
Climate Change Isn't Just the Hottest Year
Perhaps that is the lesson I find most interesting in comparing 2024 and 2025.
If we judged climate change by a single season, 2025 might appear reassuring. Sacramento was substantially cooler during parts of the summer than it had been during the extraordinary heat of 2024. My Napa Garden certainly noticed.
But one cooler year does not erase the pattern any more than one cold winter disproves global warming.
That is precisely why the warming stripes are so powerful.
They ask us to stop looking at one stripe.
Look at all of them.
The global record tells us that 2024 was the warmest year observed in records extending back to 1850. It was also the first calendar year in the Copernicus dataset to average more than 1.5°C above the estimated preindustrial level. The ten years from 2015 through 2024 were the ten warmest years on record at that time.
Then 2025 arrived slightly cooler than 2024—and still became Earth's third-warmest year on record.
That is climate change.
Not a perfectly straight line upward, but a shifting baseline around which our weather now fluctuates.
The individual stripes still vary.
The canvas itself is getting warmer.
Reading the Garden…
As an artist and someone who spends a great deal of time thinking about our relationship with the natural world, I find something deeply grounding about seeing climate change through a garden.
A garden keeps us honest.
Plants respond to the world as it is—not the world we remember, expect or would prefer it to be.
They respond to soil temperature, nighttime temperatures, water availability, sunlight, pollinators, humidity and extreme heat. They tell us when conditions are favorable, and they tell us when something has shifted.
They are, in their own quiet way, environmental witnesses.
That doesn't mean one tomato can prove climate change. Nor does one successful cucumber season constitute climate data.
But when our personal observations begin echoing measurements collected across decades, they can help us understand what those measurements actually mean.
The climate stripes tell the story at planetary scale.
The Sacramento stripes bring it closer to home.
And sometimes, all I have to do is walk outside and look at my garden…
The data is no longer abstract.
I'm growing in it.